High-Speed PCB Design Analysis: Simulations and Signal Integrity Checks

High speed PCB design analysis is an admittedly broad area, comprising basic calculations of important design details, as well as simulations to verify a PCB layout. Some important evaluations are performed in the schematic, or at the very beginning of a design when a layout is being planned. These analysis techniques also have different levels of difficulty or advancement, and they will sometimes require an external program to fully evaluate the noise and signal behavior in a PCB.
In this article, I'll examine these analysis techniques and at what level they help you qualify a design. Some of these techniques can be performed inside your EDA tools, or with an external program, before you do schematic capture and begin the PCB layout.
How to Analyze Your High-Speed PCB Design
There are multiple types of simulations that can be performed at different levels. Starting with the schematic, then later in the PCB layout, there are different points to focus on with different levels of advancement.
Basic Analysis
There are a few basic up-front analyses you can perform to ensure your high-speed channels are designed to spec and will operate as intended. These are solidly front-end analyses that you can perform with high-speed channels in the schematic and before creating the PCB layout. Typically, if you are planning high-speed PCB layout, then you should start with some important up-front analyses to ensure signal integrity.
- Preliminary placement: Assuming your schematics and BOM are locked-in, it helps to do a preliminary placement. This initial placement can help you determine how many signal layers you will need based on net crossings and component orientation. Note that the number of signal rows/columns on a BGA will also drive layer count.
- Start with the stackup: Based on the routing paths and layer count you determine from #1, plan out where important interfaces will be routed around the board, then look for a standard stackup or build your own stackup.
- Size traces and differential pairs for impedance control: Once your stackup is created, make sure you can size pairs properly for impedance control. For manufacturability, it may be a good idea to place different impedance interfaces on different layers so that only one impedance measurement is needed for verification and stackup modification on each layer.
- Loss estimation: If you will be operating above 5-10 GHz bandwidths (based on either rise time or Nyquist frequency), then it is a good idea to estimate losses and compare this with your estimated routing distance.
These front-end points may be basic, but they are very important to the overall functionality of your product. The links below can provide more guidance on these analysis tasks.
- View some useful resources for estimating impedance
- Learn more about designing differential pairs
- Learn more about estimating copper roughness

Intermediate Analysis
Next is an intermediate analysis, where things like power stability and transmission line models can be evaluated. At the intermediate level, designers can perform two important analyses and simulations in the pre-layout phase:
- Power requirements: What power can you expect your design ot pull when switching at fast speeds? This will justify the use of very large rails or planes in your stackup. This can also give you a target for the decoupling capacitance you will need in the design.
- SPICE simulations with transmission line models: Some schematic editors and simulation packages have a transmission line model integrated into the software (including Altium Designer). The idea here is to identify compatibility between interface models on different components, which may be available as subcircuits in your components.
- Waveform analysis (see below): Inside the PCB layout, signal waveforms can be visualized with the goal of showing signal behavior due to crosstalk and reflections.
The idea here is to better determine whether the front-end design can support the required level of power and signal integrity for your PCB layout. For power integrity, your goal is to determine whether you have placed enough capacitance on each rail to ensure sufficiently low noise, as well as to ensure the flat impedance extends to sufficiently high bandwidth. In the end, this can be visualized in a transient analysis simulation, where the power fluctuation on your core voltage rails can be seen and compared with the core level. Too much overshoot/undershoot such that the core voltage falls outside the required range listed in a datasheet can cause some functions on a component to work improperly.
For transmission line simulations with SPICE models, the idea is to ensure sufficient signal transmission within a broad bandwidth given a transmission line model. At minimum, this involves the capacitance and inductance extracted from the transmission line impedance (this can be seen in the Layer Stack Manager in Altium Designer).

Inside the PCB layout, there are some important verification simulations that can be performed once some sections of routing are completed. These simulations are part of waveform analysis, and they intend to show how signals interact with the structure of a PCB layout in the time domain. There are two basic sets of simulations that can be performed as part of waveform analysis:
Crosstalk - This can be performed with an integrated numerical solver (BEM or MoM solver) inside some EDA tools. Crosstalk evaluation can be performed for specific groups of nets that may have close location to other nets, or that need to carry low-noise signals. Note that, for nets carrying analog signals, you should still perform crosstalk waveform simulation so you can determine whether any nearby digital nets will induce excessive crosstalk on a victim net. This would be visualized as shown below:

In the above example, we have approximately 1.5% noise coupling into the victim net. If the victim is also operating at 3.3 V, and the allowed noise margin is +/- 300 mV, then we can say that the crosstalk into this victim net would be acceptable. There will always be some small amount of crosstalk, but it is important to ensure that the crosstalk will not excessively distort a signal on a victim net.
Reflection waveforms - This allows bidirectional analysis of signal propagation and the approach to a steady state. If there is excessive impedance mismatch and the net will show reflection in the propagating signal, then this can be visualized clearly in the resulting waveform on a graph. An example is shown below, where a low-level signal with fast edge rate is being reflected from a receiver. From this example, we can see extreme overshoot on the rising edge. This indicates some termination should be included in the analysis model. Note that the termination may already exist on-die in your component, so you should check your datasheet to ensure that the termination is included and add this into your model to better understand signal behavior.

A good crosstalk tool can also give you a reading of the average impedance of a net. This value might not take account of nearby nets or parasitics in the same way as a crosstalk simulation, so be sure to check your documentation on your solver to determine this. If there is an impedance deviation, you should note that these tools also will not show you specifically where the impedance deviation exists unless you use a more advanced field solver.
Advanced Analysis
These analysis tasks are normally performed after the PCB layout is completed and are intended to evaluate the PCB layout's noise and emissions performance. These tasks can help designers determine whether stackups are appropriate, power integrity is maintained, or exccessive noise is being emitted from specific board regions, and required changes can be made to the PCB layout accordingly.
Waveform analysis with IBIS models - In waveform analysis, an important part of the simulation process is to model the I/O buffer in the driving and receiving circuits. In an intermediate waveform analysis (crosstalk and reflections), the simulation designer would select a logic family that approximately matches the component behavior. A better approach is to use a model that follows the input-output buffer information specification (IBIS), or IBIS model. These models simulate the behavior of a specific I/O pin in an integrated circuit package so that the interaction between the pin and the channel can be accurately predicted.
Once the model is assigned to the relevant pins in the driver and receiver sides of a high-speed link, the standard crosstalk and reflection waveforms listed above can be simulated. These simulations tend to be more accurate as long as the IBIS model for the buffer is also accurate. Typically, some front-end measurements of buffer behavior are needed to determine the accuracy of a buffer model and to construct the buffer model.
Radiated and conducted emissions - These simulations intend to calculate the distriburtion of the electromagnetic field radiated around the PCB, particularly the emission radiated from the surface layers or edges, or the current conducted to an outlet on the device. Getting accurate results from this type of simulation requires exporting a highly detailed model of your PCBA, including component bodies and embedded electrical information describing signal behavior. This type of simulation requires an electromagnetic field solver to solve Maxwell's equations inside the structure of your PCB.

Model exports for use in field solvers can contain both structural and electrical information, depending on the model format. Proprietary database formats, like the EDB format used in Ansys, are similar to MCAD models that would be exported in, for example, IDF format (.EMP/.EMN files). Make sure you understand the input information your simulation requires as EDA tools do not necessarily export this automatically.
Structural resonances - While not a direct simulation of radiated emissions, this is related to radiated emissions from the edge of a circuit board. A structural resonance simulation invovles determining the resonant modes (eigenmodes) that are defined by the internal structure of the printed circuit board between all layers. These simulations can be defined in two ways:
- As 3D distributed element models that are solved with a SPICE package
- As discretized models for use in an electromagnetic field solver
Extraction of structural resonances will be accompanied by a plot showing the prominent resonances in the frequency domain. This plot is essentially a normalized power spectrum that illustrates the most prominent frequencies that make up the electromagnetic field distribution in the internal structure of a PCB.

S-parameter extraction - This is normally something you would do as part of channel compliance because it allows you to see bandwidth limiting effects in a high-speed channel. Anything that can limit bandwidth can be seen clearly in an insertion loss plot (for long channels) or a return loss plot (for short channels); an example with an insertion loss plot is shown below. The other way this can be used is as a model for use in a different channel design. This requires an existing channel model and extraction of only the transmission line portion of the model, which can then be used in a future cascaded channel design.

Eye diagrams - This is the corresponding time-domain measurement one would examine for a channel model. These simulations can be performed in a mathematical analysis program like Matlab or an electromagnetics simulation package like Simbeor. The goal is to examine whether signals are arriving at the reciever end of a channel with sufficiently low noise and level stability, as well as with low jitter. The end goal may be to extract a bit error rate (BER) value and to determine the eye opening range. Simulation programs can perform these tasks very quickly.

When you need access to the world’s best circuit board design features that include simulation and analysis tools, try using the full suite of design features in Altium Designer®. Users can access a set of integrated pre-layout and post-layout simulation features, as well as integrations to third-party simulation applications. When you're ready to share your design, your collaborators can access your project through the Altium 365 platform, and you can access important data management features like version control and project release management.
We have only scratched the surface of what is possible to do with Altium Designer on Altium 365. Start your free trial of Altium Designer + Altium 365 today.

About Author
Related Resources


Related Technical Documentation
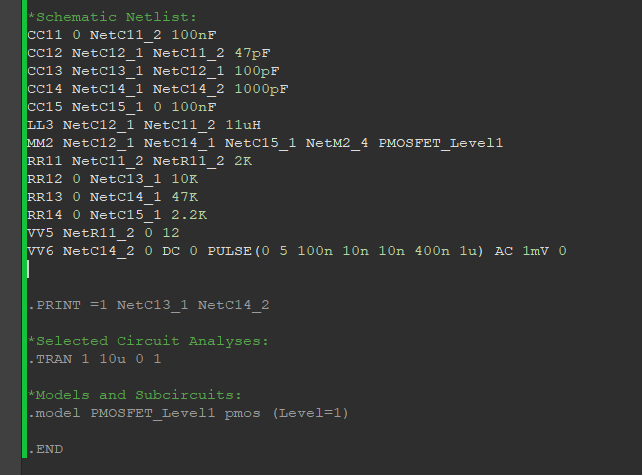

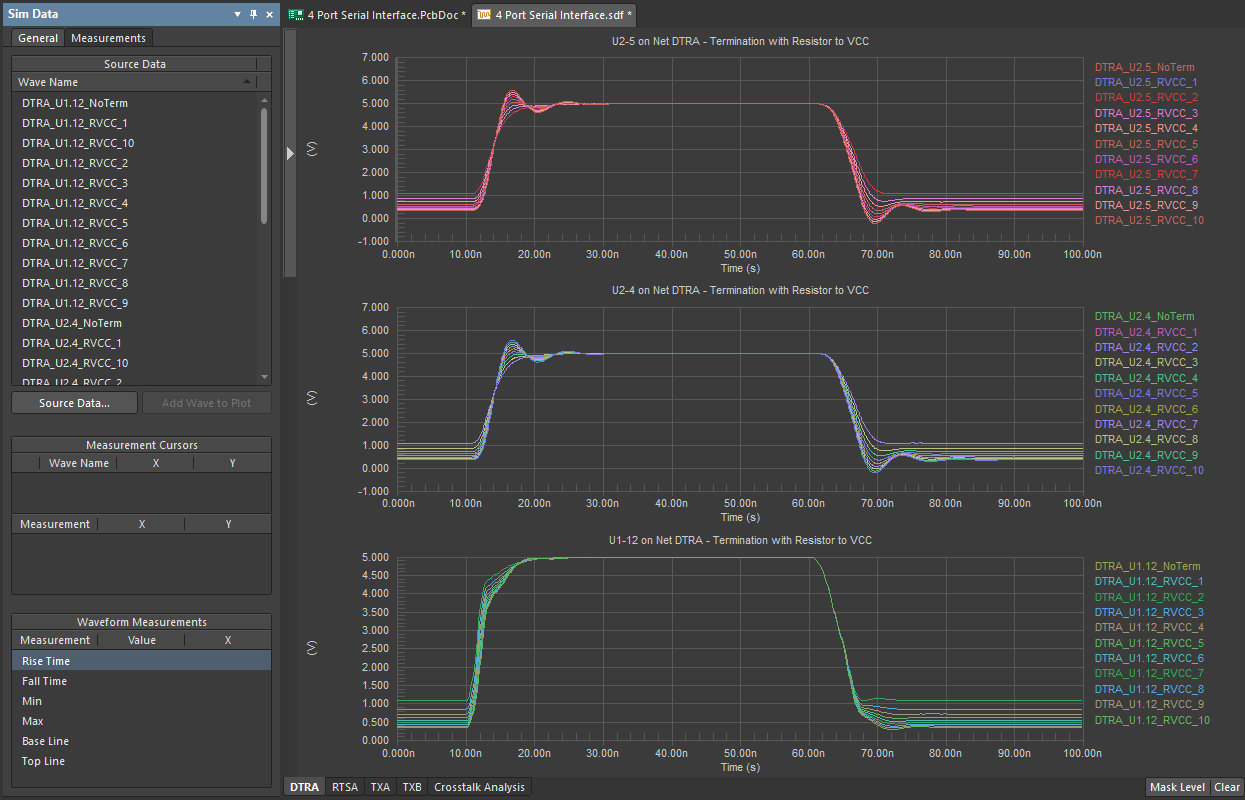

Table of Contents
Take advantage of the world's
most trusted PCB design system.
One interface. One data
model. Endless possibilities.
Effortlessly collaborate with
mechanical designers.
The world's most trusted
PCB design platform
Best in class interactive
routing
View License Options
Thank you, you are now subscribed to updates.