Download PDF





What Every Oscilloscope User Needs to Know About Transmission Lines with Eric Bogatin

At a Glance
Learn how transmission lines, cable delay, impedance, and reflections affect oscilloscope measurements and how to identify measurement artifacts.


Oscilloscope measurements are easy to misinterpret when the cable, source impedance, and scope input are ignored. A waveform on the screen is the voltage that exists at the scope input after the source, transmission line, termination, and reflections have interacted. By understanding all of these factors, it’s easier for a designer to predict and analyze scope measurements, ultimately turning a displayed waveform into a tool for debugging and updating a PCB layout.
The challenge is that a scope measurement can look reasonable even when the measurement setup is changing the waveform being observed. This becomes especially important when working with fast edges, longer interconnects, or measurements taken through coaxial cables. Understanding how the measurement setup interacts with the signal gives designers a better basis for deciding whether they are looking at actual circuit behavior or an artifact introduced by the measurement itself.
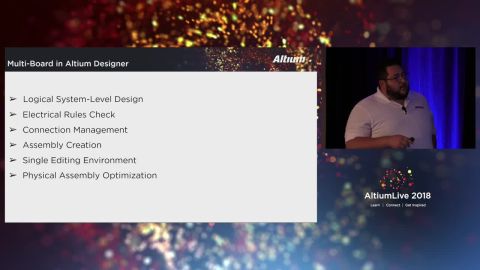
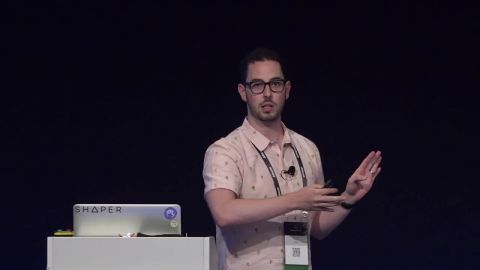
This article was compiled from the most important technical points in Eric Bogatin’s 2018 Altium Live presentation, titled What Every Scope User Needs to Know About Transmission Lines. Watch the full recording of the seminar session below:
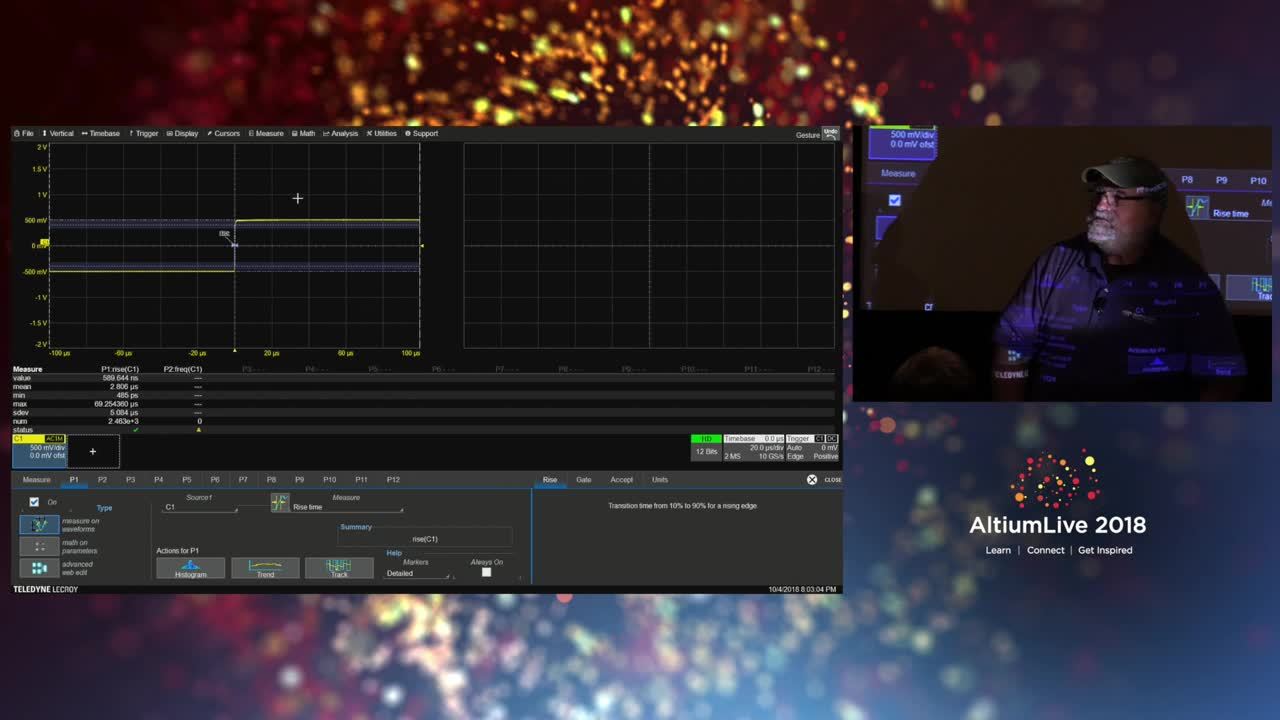
Before connecting the probe or cable, predict the result you expect. This is one of the best consistency checks available during bench measurements; not just for the system you’re analyzing, but also for your own understanding. If the waveform does not match the prediction, either the setup is introducing an artifact or the electrical model is incomplete.
Use Cable Delay to Identify Measurement Artifacts
The cable between the DUT and oscilloscope is part of the measurement system. A signal requires a finite amount of time to propagate through that cable, so any reflection created at the scope input or source also requires time to travel back through the interconnect. That delay gives you a useful way to distinguish actual circuit behavior from artifacts created by the measurement setup.
For the coaxial cable used in the demonstration, the propagation delay is about 1.5 ns/ft. A 3 ft cable therefore produces roughly 4.5 to 5 ns of one-way delay and about 9 to 10 ns of round-trip delay. If steps, ringing, or other waveform features appear at intervals close to that round-trip time, the cable and terminations should be investigated before changing the PCB or blaming the driver.
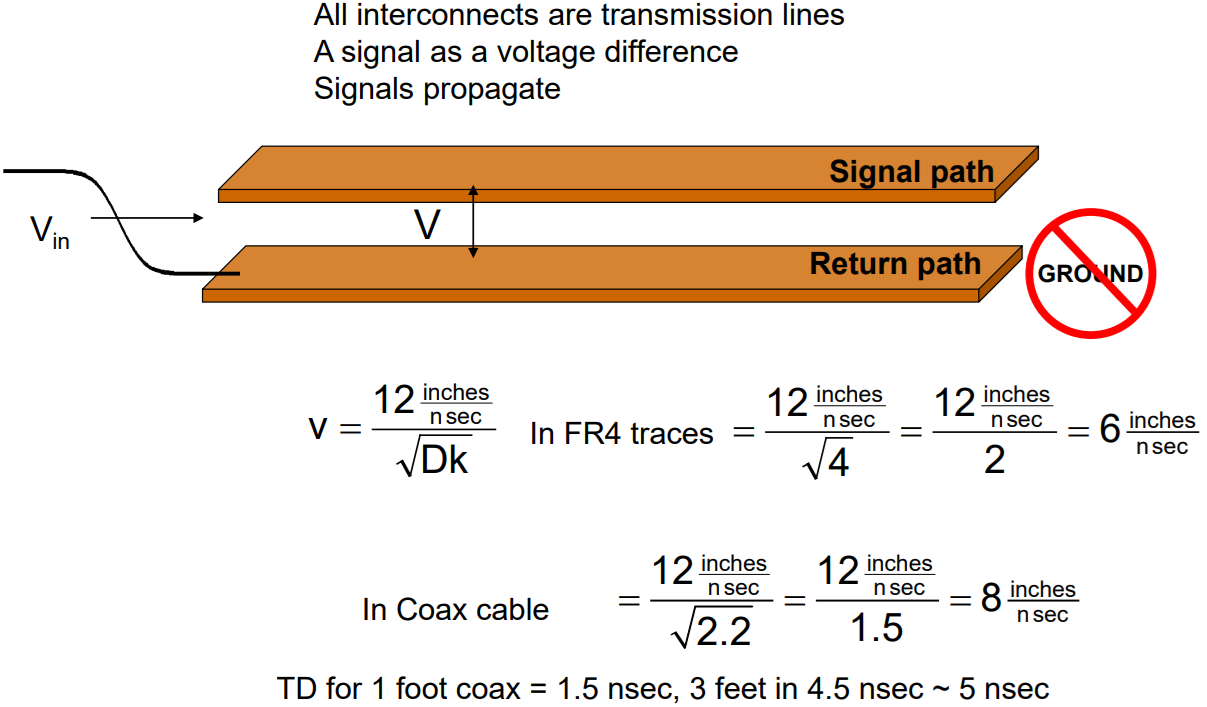
This is also why cabling should be selected deliberately based on its known characteristic impedance and approximate propagation delay, and make sure the oscilloscope input or any external termination is appropriate for that cable. For measurements where the DUT cannot tolerate a 50 Ohms load, a suitable high-impedance probe may be a better choice than connecting a long 50 Ohms coaxial cable directly to a 1 MOhms scope input.
Cable length can then become part of the debug process to determine whether repeated reflections are occurring. Changing the cable length changes the timing of round-trip reflection-related features while leaving the DUT unchanged. If a suspicious feature moves when the cable length changes, that is strong evidence that the propagation delay within the measurement setup is contributing to what appears on the screen.
What the Oscilloscope Actually Measures
A scope measures voltage at a node. It does not identify which portion of that voltage is traveling toward the scope and which portion is traveling back toward the source. This matters when a 50 Ohms cable is connected to a 1 MOhms input.
At the high-impedance input, the arriving wave sees an impedance that is effectively open compared with 50 Ohms. Nearly the entire wave reflects with the same polarity. The scope therefore measures the superposition of the incident and reflected waves. The displayed voltage can be approximately twice the amplitude of the traveling wave at that instant.
That behavior also explains why a high-impedance measurement can show a long staircase-like edge. A reflection travels back to the source, encounters the source impedance, reflects again, and returns to the scope. Repeated round trips progressively build the measured voltage toward its final value. A longer cable increases the round-trip delay, so the displayed 10-90% rise time can appear longer even when the source rise time has not changed.
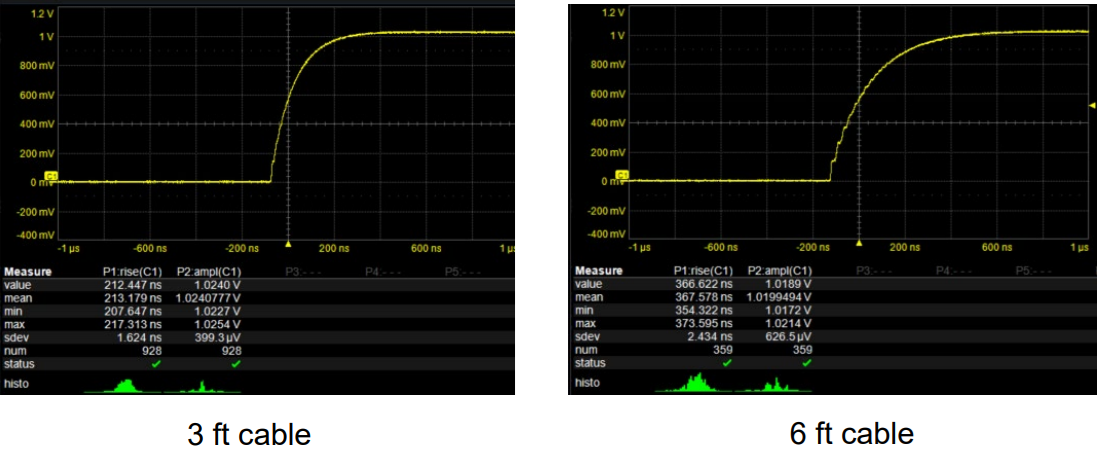
Comparison of waveforms measured with 3 ft. and 6 ft. cabling illustrating the stair-step nature of signal rise due to repeated reflections. This shows how transmission-line reflections make the measured rise time appear dependent on cable length.
Characterize the Source Before Interpreting the Edge
Source impedance determines how much signal is launched into the cable and what happens when reflections return. Two measurements can provide a useful first-order source model.
First, measure the output with a high-impedance input after the waveform has reached steady state. This gives an approximation of the open-circuit Thevenin voltage. Next, apply a known load, such as the oscilloscope's 50 Ohms input when the voltage and power ratings allow it, and measure the loaded voltage. The source resistance can then be calculated from the voltage-divider relationship:
Rsource = Rload × (Vopen/Vloaded - 1)
Once the source voltage and source resistance are known, the amplitude launched into a 50 Ohms cable and the expected measurement amplitude at the scope input becomes predictable based on the Thevenin equivalent of the DUT source. The measured waveform can then be checked against the expected reflection sequence rather than interpreted only by its visible rise time.
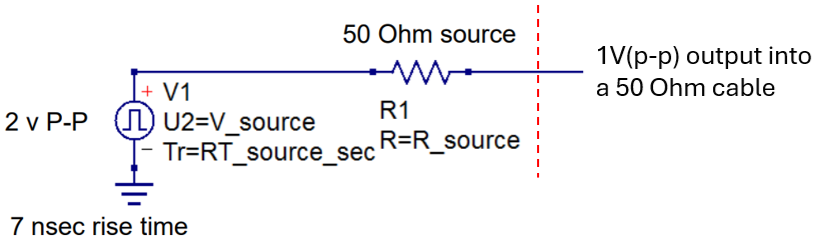
The expected amplitude at the output is known based on the Thevenin equivalent and the input impedance looking into the attached cable. For fast rise times, long cables will appear to be 50 Ohms input impedance. The load impedance then determine the expected signal amplitude because the reflections can be predicted.
Choosing the Scope Input
Using a 50 Ohms input on an oscilloscope is the cleanest choice when the DUT is intended to drive a 50 Ohms load or when the DUT requires a specific load impedance. Before using it, verify the oscilloscope's maximum input voltage and power rating. A high-impedance input is appropriate when the DUT cannot tolerate a 50 Ohms load, but the engineer must then account for cable reflections or use a probe designed for high-bandwidth, high-impedance measurements.
Measurement approach | When used | Measurement impact |
50 Ohms input | Terminates a 50 Ohms cable and suppresses reflections at the scope input | Loads the DUT and can reduce measured amplitude |
1 MOhms input | This will minimize low-frequency loading of the DUT | Creates a large impedance discontinuity with 50 Ohms coax, allowing reflection artifacts |
High-impedance active or compensated probe | Reduces DUT loading without directly terminating the source to 50 Ohms | Probe bandwidth, compensation, and connection inductance can add their own artifacts |
Use Reflection Timing as a Consistency Check
Reflection artifacts often contain enough timing information to identify their own cause. If a 3 ft cable has about 5 ns of one-way delay, a reflection can return to the same end roughly 10 ns later. Repetitive steps or ringing related to that interval are strong evidence that the interconnect and terminations are shaping the measurement.
When a low-output-impedance driver is connected through a 50 Ohms cable to a 1 MOhms scope input, the reflection at the scope returns to a much lower source impedance and changes polarity. Multiple round trips can then appear as ringing. Switching the scope to a matched 50 Ohms input removes the reflection at the receiving end and can eliminate that ringing from the measurement.
Use the following steps to check whether the measurement setup is shaping the waveform:
- Predict the expected waveform from the source impedance, cable impedance, cable delay, and scope termination.
- Check whether visible steps or ringing line up with the cable round-trip time.
- Repeat the measurement with a matched termination when the DUT can safely drive it.
- Treat any large change between the two setups as evidence that the measurement network is affecting the waveform.
An oscilloscope trace is only as useful as the electrical model used to interpret it. For fast edges, the source, cable, and scope input form one measurement system. Characterize the source, know the propagation delay, track the reflections, and choose the termination deliberately. Those steps turn a waveform from a picture on the screen into a measurement you can trust.
Whether you need to build reliable power electronics or advanced digital systems, use Altium’s complete set of PCB design features and world-class CAD tools. Altium provides the world’s premier electronic product development platform, complete with the industry’s best PCB design tools and cross-disciplinary collaboration features for advanced design teams. Contact an expert at Altium today!

About Author
Related Resources
Related Technical Documentation
Table of Contents
Solutions for Every Role and Team
- Discover and evaluate design options earlier
- Develop in one shared workspace
- Scale with control and compliance
- Connect every stage of hardware development
Learn More
Thank you, you are now subscribed to updates.