How Inventory History Helps You Spot Part Trends Early

At a Glance
Stop gambling on now. Use Octopart Inventory History to spot trends, avoid ghost inventory, and turn data into a genuine competitive advantage.


The procurement of electronic components has long been a game of now. For years, engineers and purchasing managers have based high-stakes decisions on a single, static data point – what is in stock at this exact second.
While that might satisfy the immediate need to fill a Bill of Materials (BOM), it is a strategy built on a foundation of guesswork. Choosing a part simply because it is available today is a gamble. Without context, you have no way of knowing if that stock is on a steady downward trend or subject to the kind of erratic swings that derail production schedules.
To move beyond this reactive firefighting, the industry must shift toward historical analysis. Seeing where a part has been is the only reliable way to predict where it is going. By leveraging Octopart’s Inventory History, powered by Nexar Spectra, teams can finally bridge the visibility gap and turn raw data into a genuine competitive advantage.
Key Takeaways
- Inventory History replaces guesswork with real data. Octopart’s Inventory History, powered by Nexar Spectra, uses verified distributor data and 3‑/12‑month timelines to reveal true supply patterns and avoid relying on a single in‑stock snapshot.
- Historical visibility prevents “ghost inventory” failures. Trends help distinguish healthy, replenished parts from those quietly disappearing due to obsolescence or distributor shelf‑clearing.
- Trend analysis turns procurement into a strategic advantage. Teams can spot volatile parts, prioritize consistently available ones, and anticipate seasonal cycles.
- Historical data supports smarter decisions across engineering and purchasing. Engineers can identify EOL risks early, while procurement can validate scarcity claims and negotiate confidently using factual market trends.
The Data Behind the Graph: What Is Octopart Inventory History?
At its core, Octopart inventory history is a risk-management tool designed to replace gut feeling with empirical evidence. However, data is only as good as its source. To ensure reliability, Octopart draws information exclusively from verified, franchised distributors. This is a crucial distinction; it filters out the noise and potential fraud often found in grey market listings, where stock levels can be artificially inflated or unreliable.
The feature is integrated directly into the Part Detail Page (PDP) via an intuitive graph, but its utility starts even earlier in the search process. As you browse results, snapshot thumbnails—quick-glance icons indicating whether stock is up, down, or steady—allow for a rapid assessment of market health without ever leaving the search results page.
To provide both tactical and strategic insights, the data is presented in two primary timeline windows:
- The 3-Month View: This is your window into short-term volatility, helping you spot immediate supply chain hiccups or sudden spikes in demand.
- The 12-Month View: This is essential for assessing long-term stability and spotting broader market trends, such as a part's slow march toward obsolescence.
By providing a macro view of market health through Nexar Spectra’s global intelligence, this tool gives users a level of regional and global context that was previously the sole domain of massive OEMs with dedicated data science teams.
Eliminating the Sourcing Blindspot
The danger of lacking historical visibility is most apparent when trying to distinguish between a healthy part and a dying one. Without history, it is nearly impossible to tell if a high-demand part is currently being restocked by the manufacturer or if an obsolete component is merely being flushed out of the market by distributors clearing remaining shelves.
This visibility gap often leads to the dreaded ghost inventory scenario. An engineer might specify a part that looks plentiful on Monday, only to find it has vanished by the time the production run starts, because they failed to see the rapid-depletion trend hidden behind that single in-stock number. When engineers inadvertently introduce these risks, they create a supply chain fragility that limits the company’s ability to scale or pivot.
Turning Data into a Competitive Advantage
When you stop viewing stock as a binary yes/no and start looking at it as a trend line, your procurement strategy shifts from defensive to offensive.
1. Spotting Supply Volatility
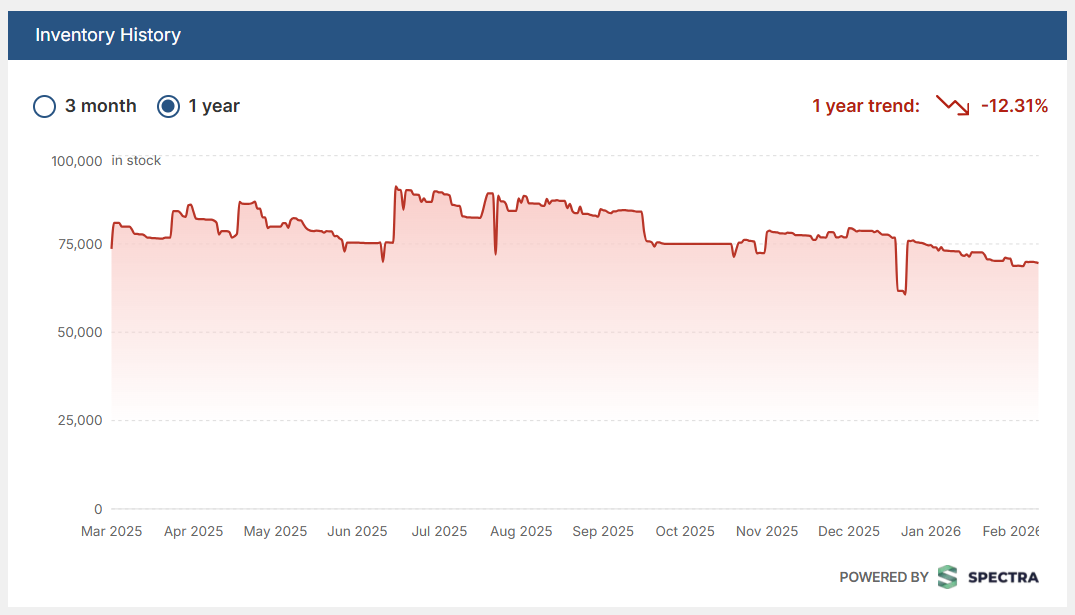
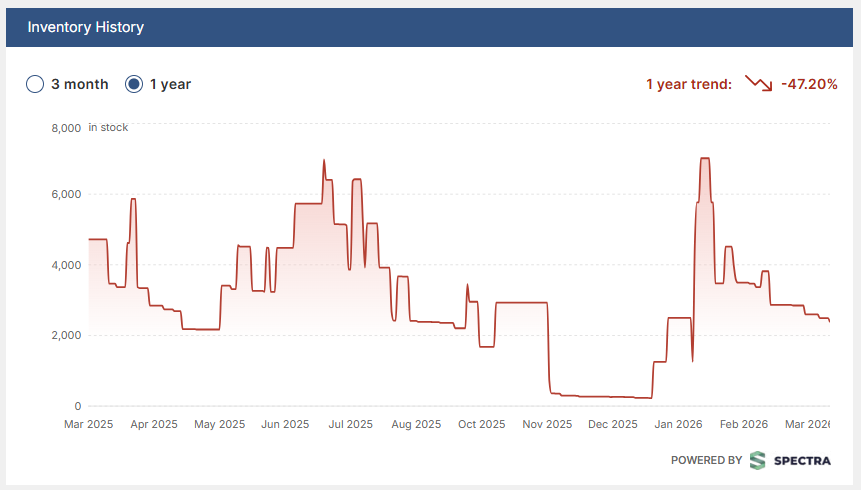
Some parts are yo-yo components. Their stock levels surge and crash with frustrating frequency. Recognizing these patterns early is a massive red flag. If a part’s history shows frequent stockouts followed by sudden surges, it suggests a manufacturer struggling with yield or a supply chain that is easily disrupted by external shocks.
2. Finding the Steady Eddies
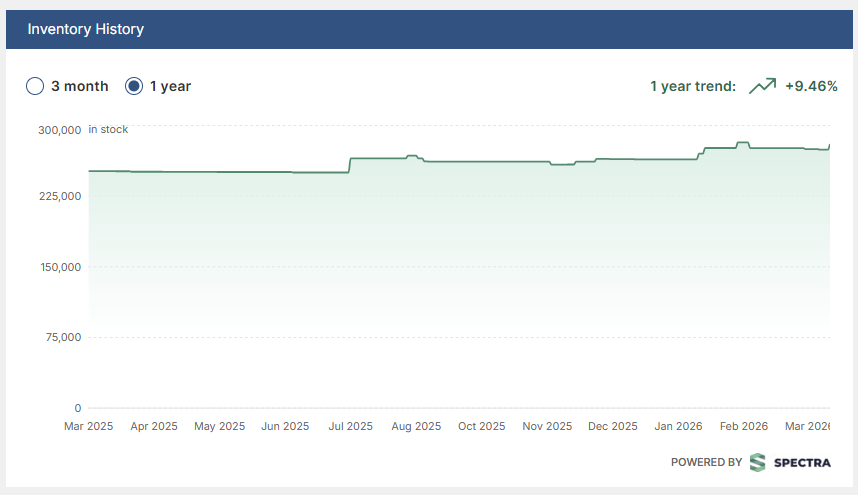
Conversely, the goal for many long-lifecycle designs is to find the steady eddies, those parts with consistent, flat-line availability. These are the safe bets. By identifying components with a history of long-term stability, you ensure that your product won't require a costly, mid-cycle redesign simply because a niche capacitor went out of production.
3. Predicting Cycles and Seasonality
The electronics market is notoriously cyclical. By using historical peaks and troughs, procurement teams can anticipate when lead times might stretch or when stock is likely to tighten. This allows for proactive procurement, buying ahead of a known depletion trend rather than waiting until the warehouse shelf is empty and the price has doubled.
Practical Use Cases: From Engineering to Purchasing
The beauty of inventory history is that it serves multiple departments, each with its own specific needs and pressures.
- For Engineers: History acts as a proxy for the component's lifecycle. If you see stock steadily declining over 12 months with no restocking spikes or upticks, that part is likely nearing its End of Life (EOL). Spotting this during the design phase, perhaps using tools like Altium Develop, saves months of headache and redesign costs later.
- For Procurement Managers: This data is a powerful lever for supplier negotiations. If a distributor attempts a price hike based on scarcity, a quick look at global inventory history via Nexar can reveal whether that scarcity is genuine or if market-wide availability is actually healthy.
- For Risk Mitigation: When choosing between two similar parts, history becomes the ultimate tie-breaker. One part might have slightly better technical specifications, but if the second part has a considerably more stable inventory history, the latter is often the superior choice for the business's long-term health.
The Past Is the Map for the Future
In an era defined by supply chain unpredictability and extreme volatility, relying on now is no longer a viable business strategy. Inventory history isn't just an extra chart on a screen but a fundamental shift in how we approach the lifecycle of a product. It replaces the frantic guesswork of the past with the cool, empirical data of the present.
The past is the best map we have for the future. By understanding where your components have been, you can finally gain the confidence to decide where your production is going.
Frequently Asked Questions
Why is historical inventory data more reliable than a single in‑stock number?
A single stock snapshot only shows what is available right now, not whether availability is stable, declining, or volatile. Historical inventory data exposes true supply behavior over time, including restocking patterns, depletion trends, and potential EOL signals. This helps teams avoid risky components that appear “in stock” today but may disappear by the time production ramps.
How can inventory history help me avoid ghost inventory and surprise stockouts?
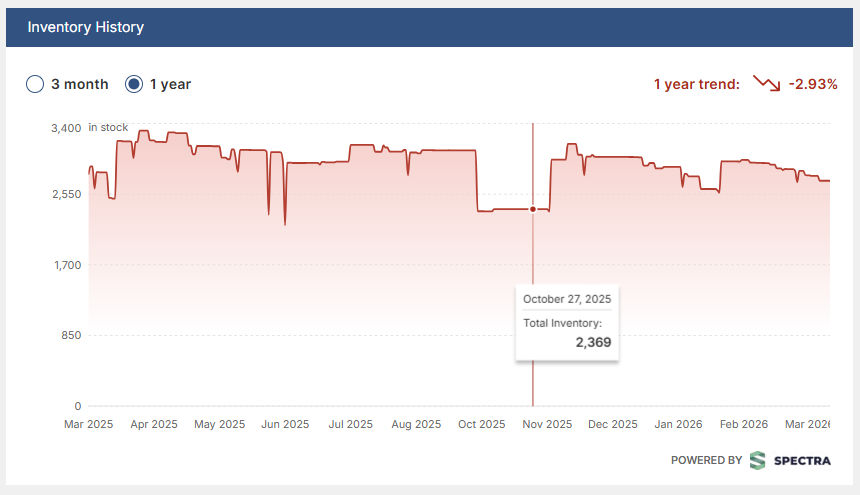
Ghost inventory occurs when a part looks plentiful but is actually in the final stages of market depletion or obsolescence. By reviewing 3‑month and 12‑month history curves, engineers can instantly see whether stock is trending downward with no replenishment. This visibility allows teams to flag unstable components early, qualify alternates, and prevent production delays caused by sudden stockouts.
What do engineers and procurement teams learn from 3‑month vs. 12‑month inventory trends?
A 3‑month view is ideal for spotting short‑term volatility, sudden surges, or brief stockouts, which helps procurement react quickly and adjust buying strategies.
A 12‑month view reveals long‑term stability, lifecycle direction, and seasonal cycles. Engineers use this view to detect EOL risk before a part is designed into a product, while procurement uses it to plan long‑range sourcing and negotiate prices with confidence.
How does inventory history improve part selection and reduce supply‑chain risk?
Historical trends turn part selection into a data‑driven decision. When comparing similar components, stable availability often outweighs small technical advantages. Inventory history helps teams:
- Identify volatile parts that could jeopardize production
- Prioritize components with consistent, replenished supply
- Predict seasonal or market-driven shortages
- Support negotiations with factual evidence

About Author
Related Technical Documentation
Table of Contents
- Key Takeaways
- The Data Behind the Graph: What Is Octopart Inventory History?
- Eliminating the Sourcing Blindspot
- Turning Data into a Competitive Advantage
- 1. Spotting Supply Volatility
- 2. Finding the Steady Eddies
- 3. Predicting Cycles and Seasonality
- Practical Use Cases: From Engineering to Purchasing
- The Past Is the Map for the Future
- Frequently Asked Questions
- Why is historical inventory data more reliable than a single in‑stock number?
- How can inventory history help me avoid ghost inventory and surprise stockouts?
- What do engineers and procurement teams learn from 3‑month vs. 12‑month inventory trends?
- How does inventory history improve part selection and reduce supply‑chain risk?
Design to Release, Without the Friction
- Keep reviews tied to the right version
- Reduce handoff confusion and rework
- Spot sourcing and release risk earlier
- Work solo, share when needed
Get Started
Thank you, you are now subscribed to updates.