


The Yttrium Shock: How a 1,500% Price Surge Quietly Hit BOMs

At a Glance
Understand how a sudden rare‑earth price shock quietly hit electronics BOMs. Learn how hidden material dependencies create risk long before production.


Nothing wakes up a procurement manager faster than a line item going from affordable to unaffordable price, especially when it’s a material you barely noticed on the BOM. That’s exactly what happened in 2025 with yttrium. What was once a rounding error on the BOM suddenly became a real cost driver. Almost overnight, prices jumped, lead times stretched, and sourcing options became limited.
The real question is: how do you avoid hidden material dependencies before they lock you in?
Octopart helps teams see beyond a single MPN and assess exposure across the entire part family. With side-by-side comparisons of manufacturers, up-to-date stock, lifecycle status, and cross-references, teams can qualify multi-vendor options early on instead of getting locked into fragile supply chains.
Key Takeaways
- Yttrium prices jumped roughly 1,500% in 2025 after Chinese export controls tightened, proving how a small upstream material can quickly become a major BOM risk.
- Material shocks move downstream fast, showing up as higher component costs, longer lead-times, and tighter availability.
- Rare-earth disruptions are systemic. When multiple approved MPNs rely on the same upstream materials, switching manufacturers doesn’t reduce risk, but simply moves you laterally within the same fragile supply chain.
- Octopart helps teams see beyond a single MPN, making it easier to compare part families, track inventory and lifecycle data, and qualify alternates before supply disruptions reach production.
What Triggered the 1,500% Jump in Yttrium Prices
In 2025, market data showed Yttrium climbing from under $8 per kilogram at the end of 2024 to roughly $120-$130 per kilogram within a year, a jump of about 1,500%.
This wasn’t driven by a sudden increase in demand or a new technical innovation. The spike was driven by US-China trade tensions and Chinese export controls on rare earths. China introduced stricter export controls and dual-use licensing requirements on several rare earths, including yttrium. That move immediately restricted exports and tightened supply to non-Chinese refiners and manufacturers. As exports slowed and supply outside China tightened, global markets reacted quickly, pushing yttrium prices to record highs.
China controls more than 70% of global rare‑earth refining capacity and roughly 85-90% of yttrium‑oxide production, meaning most of the world’s electronics‑grade yttrium still flows through a single country.

Why Yttrium Matters to Electronics
Yttrium rarely appears as a line item on a BOM. In most cases, yttrium sits deep in the value chain, embedded in phosphor powders, sputtering targets, polishing media, and ceramic formulations. What teams see are LEDs, display modules, sensors, substrates, and process-sensitive ASICs whose cost structures quietly depend on it. It’s a microscopic ingredient, but one that plays a critical role in achieving performance, thermal stability, and long-term reliability.
How a Metal Spike Hits Your BOM
- Lead Times Move Before Prices Do
When export controls tighten or quotas shift, pricing doesn’t move first. Lead-time does. Raw material supply gets allocated, and distributors see inventory buffers shrink. Buyers notice lead times stretching from 8 weeks to 16, then to 26.
- Cost Pass-Through
When critical raw material prices jump, suppliers can’t absorb it for long. The increase shows up in common components through surcharges and higher unit costs.
- Supply Allocation
By the time pricing moves, availability has already tightened. When multiple OEMs suddenly chase the same alternates, allocation accelerates. In a constrained supply, long-term contracts and strategic sectors like defense, medical, and energy often get priority. The rest of the market competes for what remains.
When volatility begins at the raw material level, the effects tend to show up as:
- Extended lead times
- Higher MOQs
- Allocation notices
- Reduced price validity windows
- And ultimately, shipment delays at the device level
- Engineering Impact
Material shortages force alternate qualification, retesting, documentation updates, and often redesigns. Each step consumes engineering time and adds incremental cost.
- Stock Disappears Quickly
Specialty material markets are small. A few large orders or safety stock build-ups can lift prices further and consume inventory fast.
Real-World Impacts on Device Pricing
Let’s break down how a raw-material spike quietly changes your device costs.
If an MLCC moves from $0.12 to $0.19 due to pressure on yttrium-related material costs, the per‑unit increase is $0.07, representing a 58% rise.
Now scale it:
- 1M units = $70,000 extra
- 5M units = $350,000 extra
- 10M units = $700,000 extra
And MLCCs are rarely single-quantity parts. A typical industrial or automotive board often uses 20 to 100+ MLCCs.
Even a $0.07 increase affecting only 20 capacitors per device adds $1.40 per PCBA. Across 1 million units, this translates to $1.4 million in incremental annual cost.
That’s how a small shift in a common ceramic component quietly reshapes your BOM economics.
The real issue isn’t just price. It's a concentration risk. When multiple approved MPNs rely on the same upstream materials, switching suppliers doesn’t solve the problem. The fragility is embedded in the material layer, not the logo on the reel. You’re simply moving laterally inside the same fragile chain.
That’s what makes rare-earth volatility different from a normal supply disruption. It’s systemic, not vendor-specific.
In a yttrium-driven disruption, you may see:
- Multiple manufacturers raise prices within weeks
- Lead times stretch across part families
- Spot availability dries up
- Tighter NCNR conditions
How Octopart Helps Teams Avoid Locking into Fragile Supply Chains
Octopart isn’t just another electronic component search engine. It is a structured visibility layer across part families, manufacturers, distributors, component lifecycle, and cross-references, so you can see the bigger picture before a supply disruption hits your BOM.
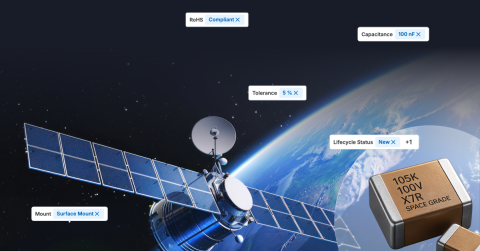
Parameter-Driven Filtering
Instead of locking you into one MPN, Octopart groups components by shared electrical characteristics. Search for “10 µF ceramic capacitor” and you can explore entire families based on capacitance, voltage rating, tolerance, package size, dielectric type, such as X7R, or footprint, and more. This speeds up engineering validation when you need to pivot under pricing pressure. You quickly surface a wide pool of functionally comparable options rather than one narrow result.

Lifecycle and Compliance Visibility
Compliance information and lifecycle status appear across multiple distributors in a single interface. Instead of jumping between supplier sites, teams can quickly verify regulatory requirements, identify parts approaching end-of-life, and assess supplier coverage. That consolidated visibility helps procurement teams detect supply concentration or lifecycle risk early, before it turns into a sourcing constraint.

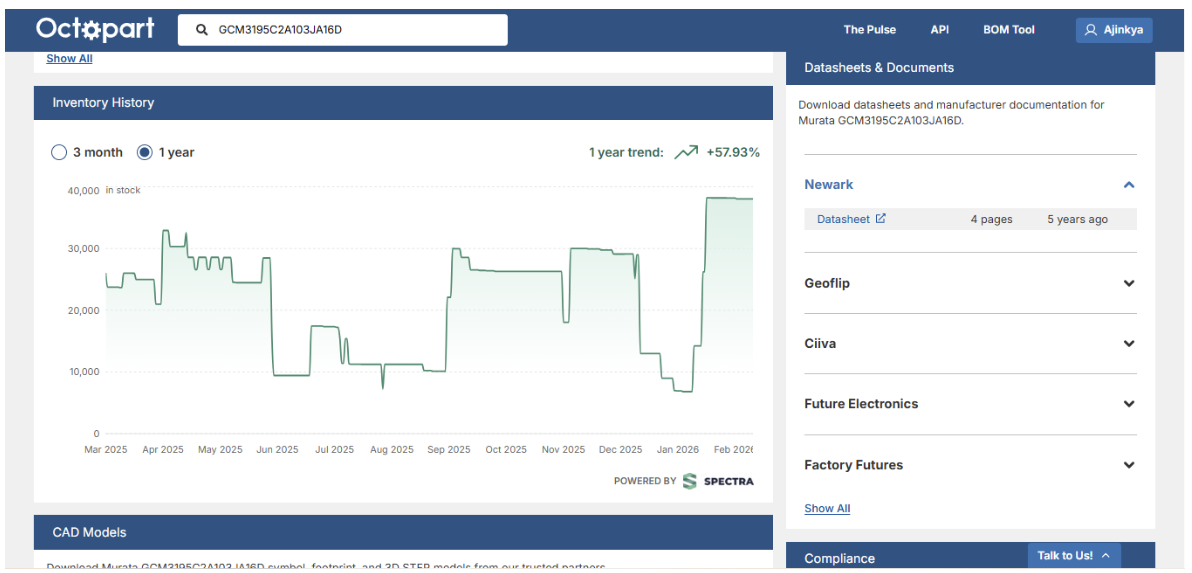
Up-to-Date Stock Visibility
Octopart shows up-to-date distributor inventory and pricing in a single view, but just as important, it lets you see inventory history trends. That historical view reveals when stock is slipping over time, making you aware of tightening supply before it turns into longer lead times, price increases, or allocation.
Rapid Substitute Validation
When a part becomes exposed to material or geopolitical risk, Octopart provides direct access to datasheets, footprints, and ECAD models to help you verify compatibility against real technical documentation rather than assumptions. You can approve alternate parts with confidence. Filters like RoHS and lead-free status make it easy to compare substitutes instantly.

BOM-Level Flexibility
The Octopart BOM consolidates all data into a single, clear view, making it easy to spot qualified alternates, compare preferred suppliers, and flag potential obsolescence risk. Instead of reacting to sudden supply disruptions, such as rare-earth price swings, teams can make informed decisions early.

Geographic Diversification
By highlighting manufacturers across multiple regions, it becomes easier to reduce exposure to concentrated sourcing and soften the impact of sudden price or lead-time shocks.

In short, Octopart helps you build a BOM that won’t break when the supply chain does. Instead of reacting after lead times stretch or prices spike, you can see alternative pathways earlier and make controlled, data-backed adjustments before disruption reaches production.
The Real Lesson from the Yttrium Spike
Six months after the yttrium spike, the gap between teams became clear.
Some organizations are still in firefighting mode, dealing with purchase orders stuck in allocation, last‑minute redesigns, and cost increases that must be justified up the chain.
Others moved differently. They recognized the early warning signs as inventory began to tighten across the market – first among multiple suppliers, then in parallel lead‑time extensions, and finally in pricing that began to drift upward across entire part families. With tools like Octopart, they didn’t wait for a single MPN to fail. Instead, they broadened their options, qualified alternates, and made adjustments early, well before the squeeze reached production.
The difference wasn’t luck but visibility. Teams using Octopart aren’t forced into last-minute reactions. They stay ahead by building flexibility into their BOMs, maintaining visibility across part families, and making informed sourcing decisions before constraints hit.
Frequently Asked Questions
Why does a rare‑earth metal like yttrium affect electronic component pricing?
Yttrium is embedded deep in the electronics supply chain, used in ceramic dielectrics, phosphors, substrates, and specialized manufacturing processes. When yttrium prices spike or exports are restricted, component manufacturers face higher material costs and constrained supply. These pressures move downstream quickly, showing up as longer lead times, surcharges, and higher unit prices for common components like MLCCs, LEDs, and display modules, even if yttrium never appears directly on the BOM.
Why doesn’t switching to another manufacturer reduce rare‑earth supply risk?
Because rare‑earth disruptions are systemic, not vendor‑specific. Multiple approved MPNs across different manufacturers often rely on the same upstream materials and refining capacity. When yttrium supply tightens, pricing and availability shift across entire part families simultaneously. Switching manufacturers without understanding material dependencies simply moves risk laterally within the same fragile supply chain.
What are the earliest warning signs of a material‑driven supply disruption?
Lead‑time expansion usually appears before pricing changes. Early indicators include shrinking distributor inventory, lead times stretching across multiple suppliers, reduced price validity windows, and higher MOQs. When these signals appear across an entire component category, not just a single MPN, it often indicates upstream material pressure rather than isolated demand.

About Author
Related Resources
Related Technical Documentation
Table of Contents
- Key Takeaways
- What Triggered the 1,500% Jump in Yttrium Prices
- Why Yttrium Matters to Electronics
- How a Metal Spike Hits Your BOM
- Real-World Impacts on Device Pricing
- The Hidden Risk Teams Can’t See
- How Octopart Helps Teams Avoid Locking into Fragile Supply Chains
- The Real Lesson from the Yttrium Spike
- Frequently Asked Questions
Design to Release, Without the Friction
- Keep reviews tied to the right version
- Reduce handoff confusion and rework
- Spot sourcing and release risk earlier
- Work solo, share when needed
Get Started
Thank you, you are now subscribed to updates.